EuroFab Progress Meeting
Eurofab team
2024-02-07
Agenda
- Progress overview
- Morphometric model progress
- AI model progress
- Stakeholder engagement progress
- Project continuation
- Discussion
Where we are
WP 200 & WP300
- Progress on morphometric components
- Progress on imagery components
Each including relevant data collection.
Progress on morphometric components
Morphometric classification homogenisation protocol
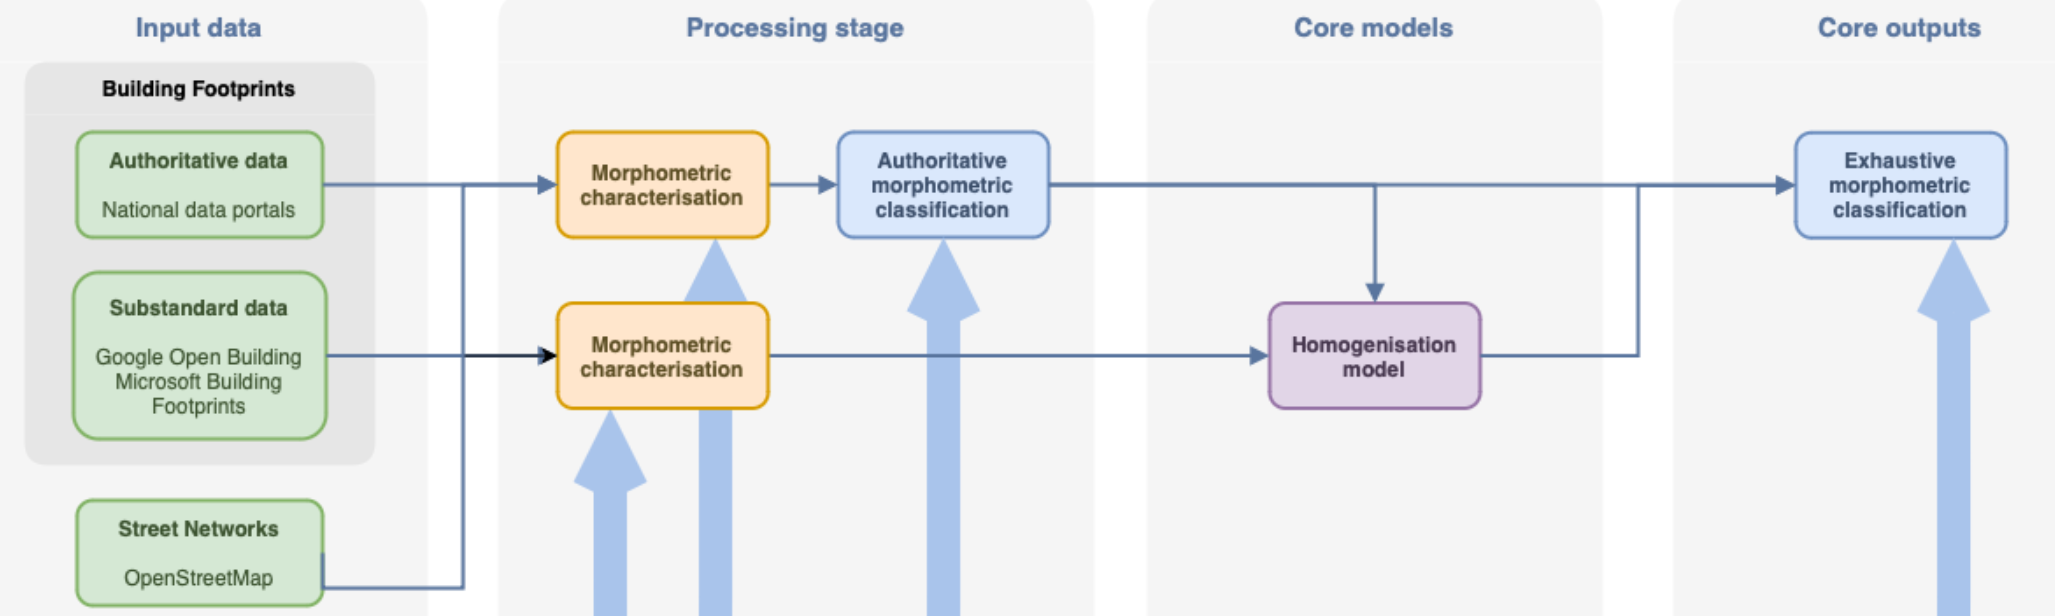
Protocol design
- Use morphometric classification of Central Europe from a parallel research project as ground truth data
- Calculate morphometric characters on subpar, but homogenous and widely available data, using enclosed tessellation cells (ETCs) as the base unit of analysis
Protocol design
- Train a supervised model to predict the classification of ETCs directly from the calculated morphometric characters, using the morphometric classification data as a target label
Protocol design
- Test the model on an out of training sample country to validate the approach.
- For example, train the model on Poland, Germany, Austria, Slovakia and test it on Czechia.
Input data collection and preprocessing
- Morphometric classification of Central Europe (UPDATE)
- Microsoft Building footprints (UPDATE)
- Implementation ( UPDATE )
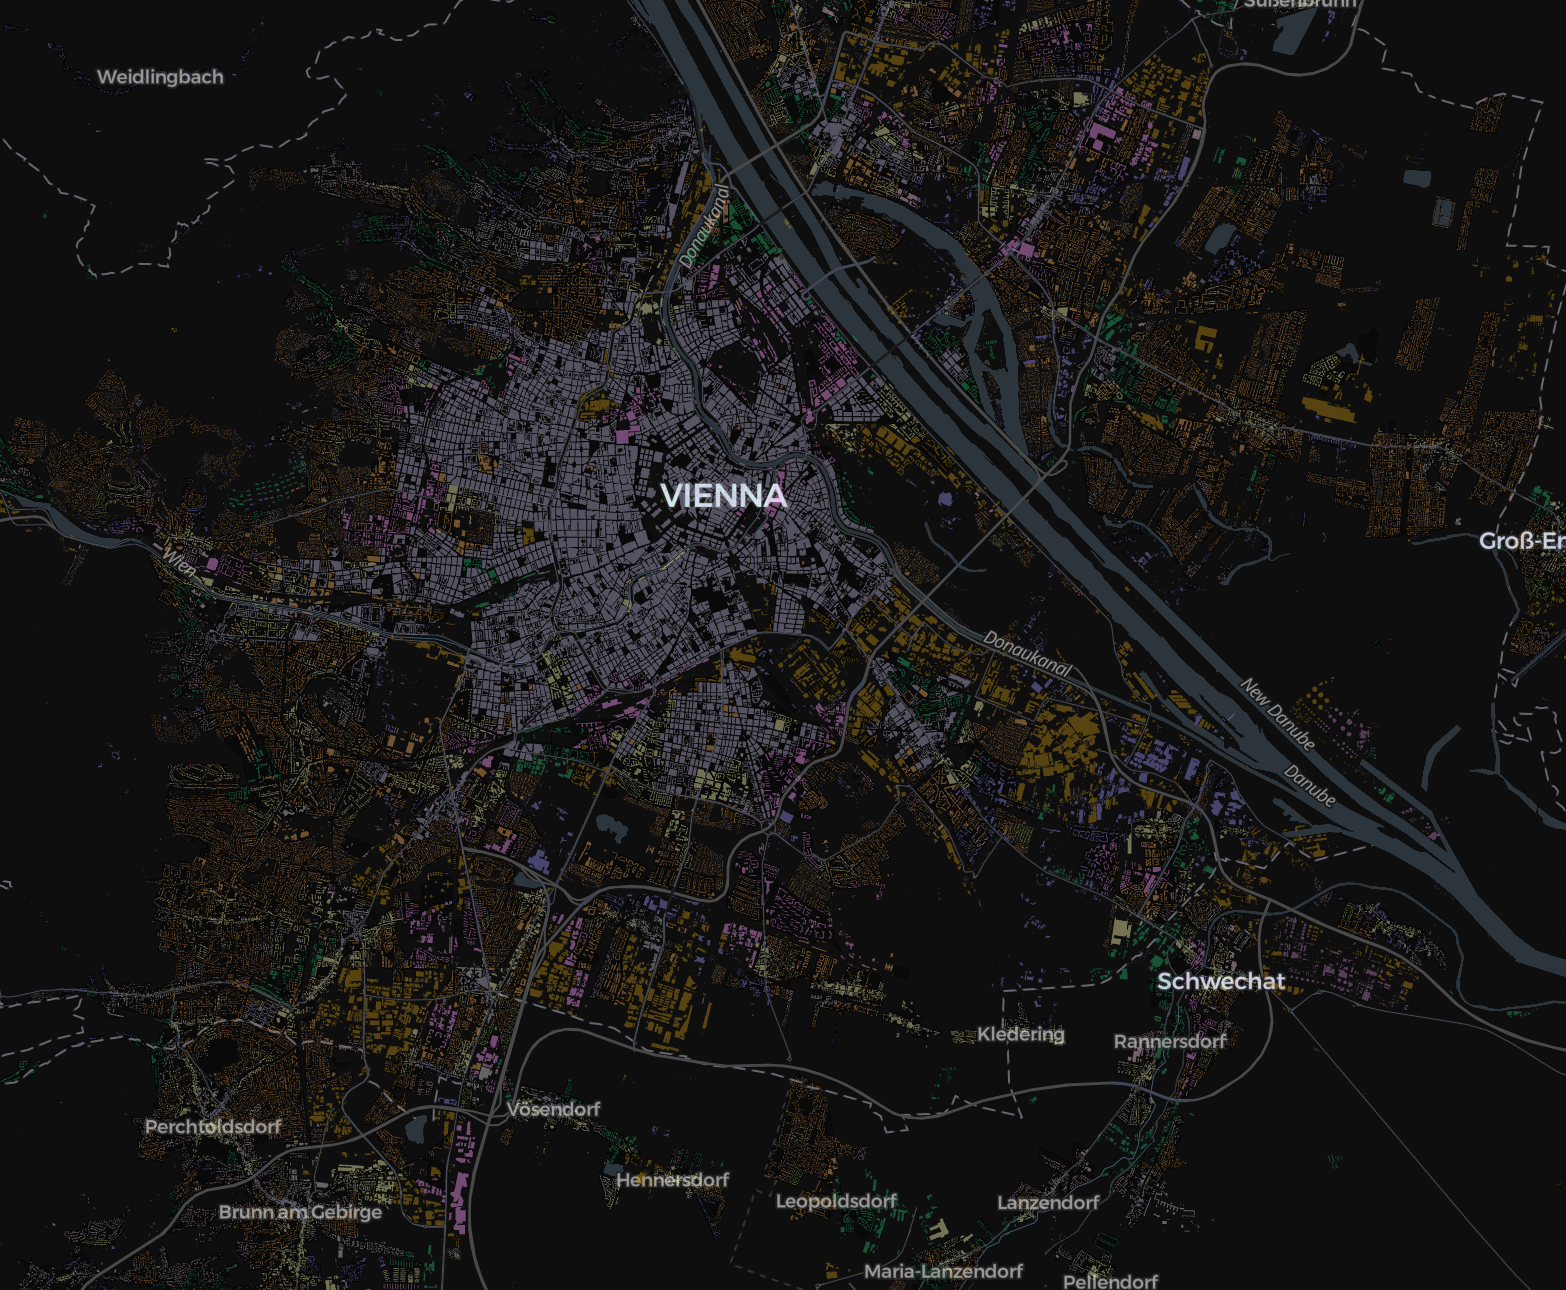
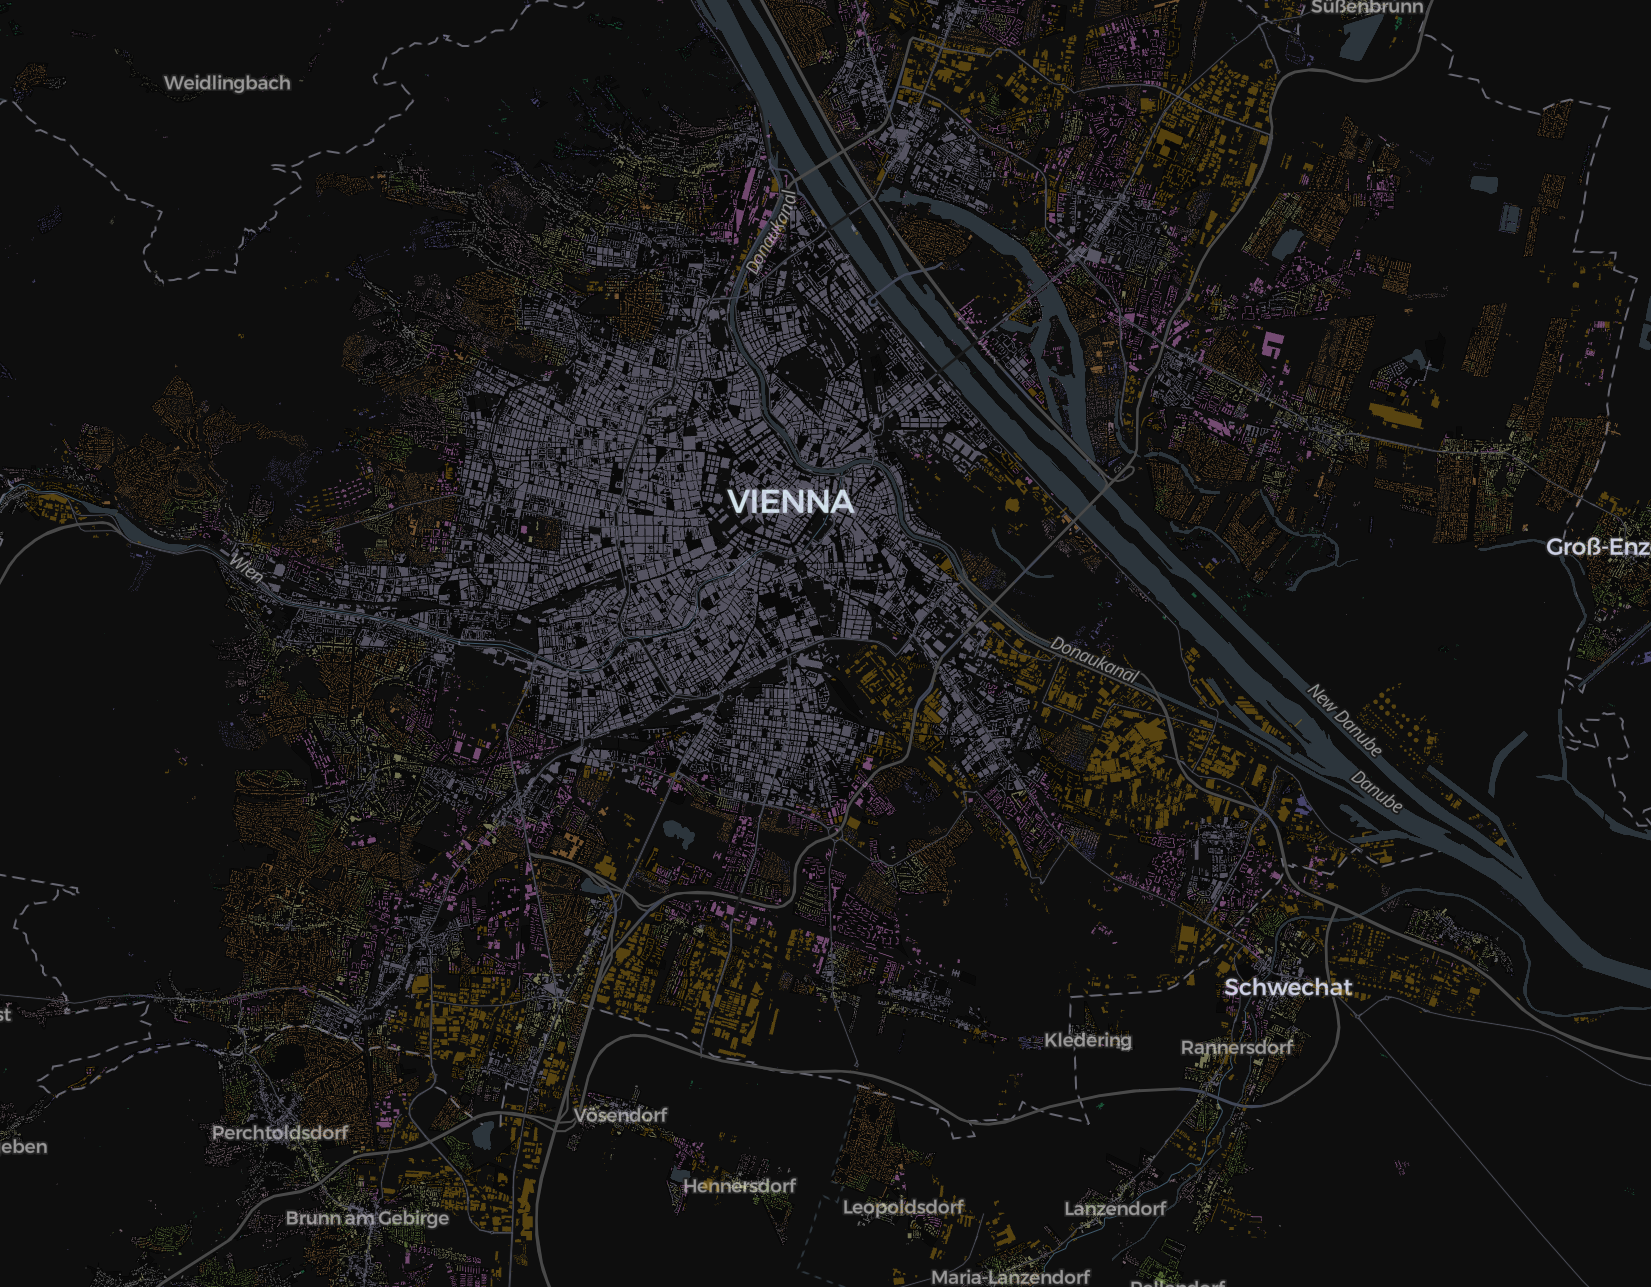
Detailed morphometric classification
- New iteration of the hierarchical classification, based on feedback from stakeholders.
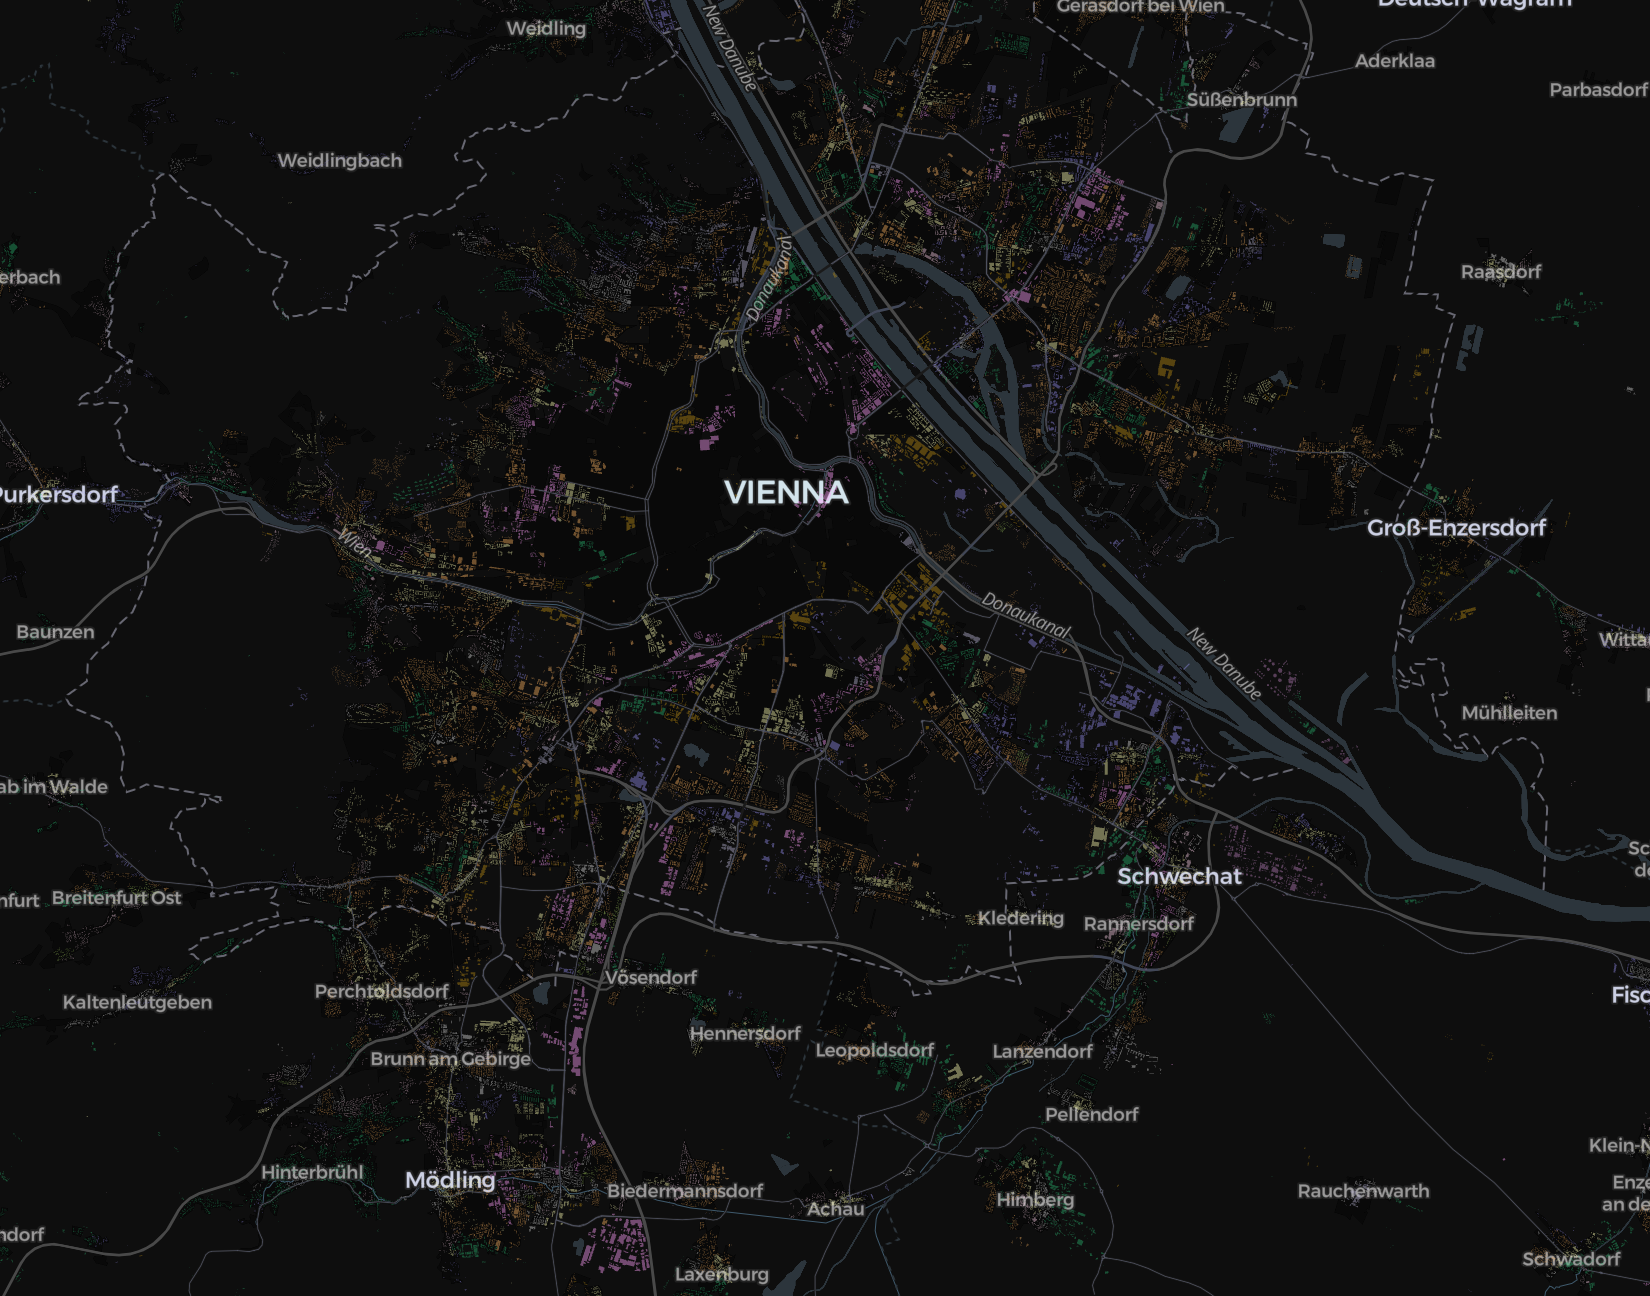
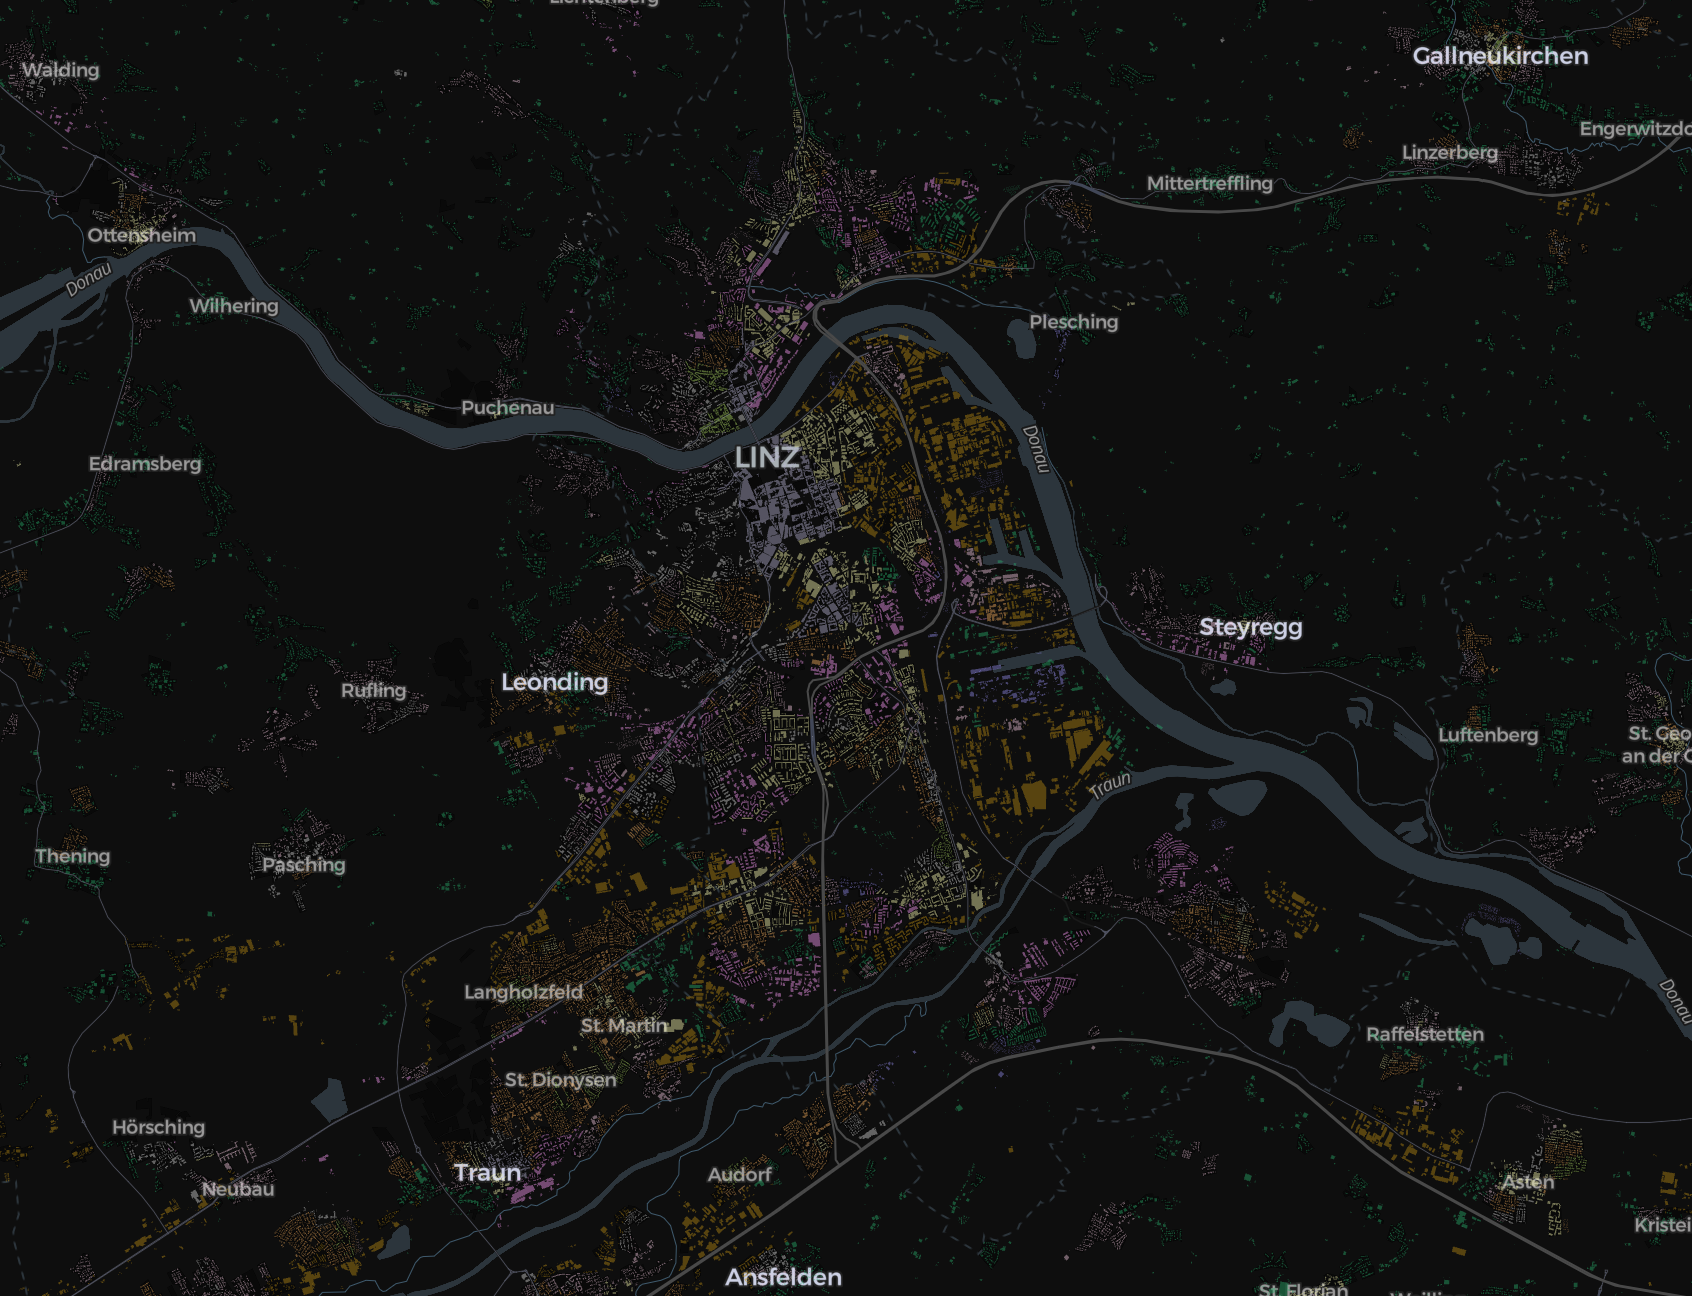
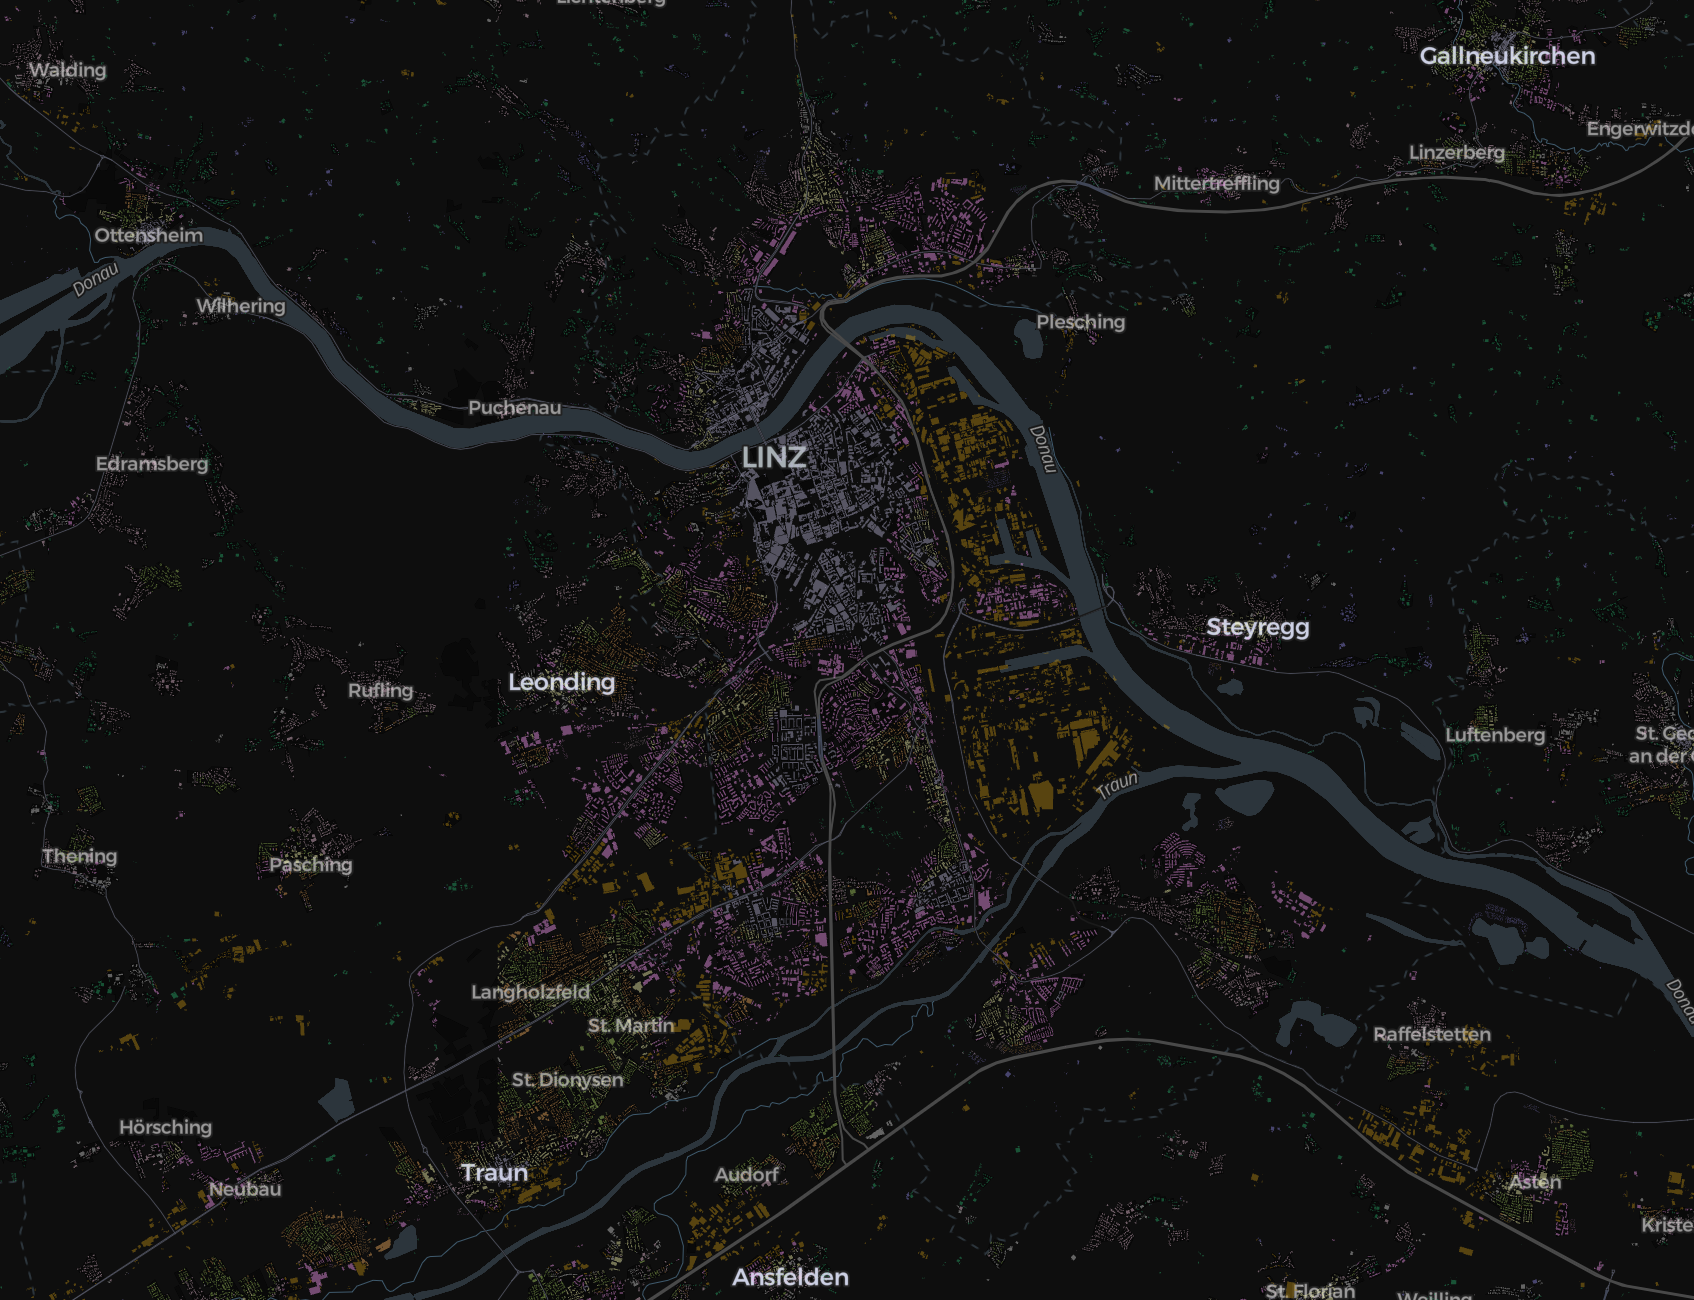
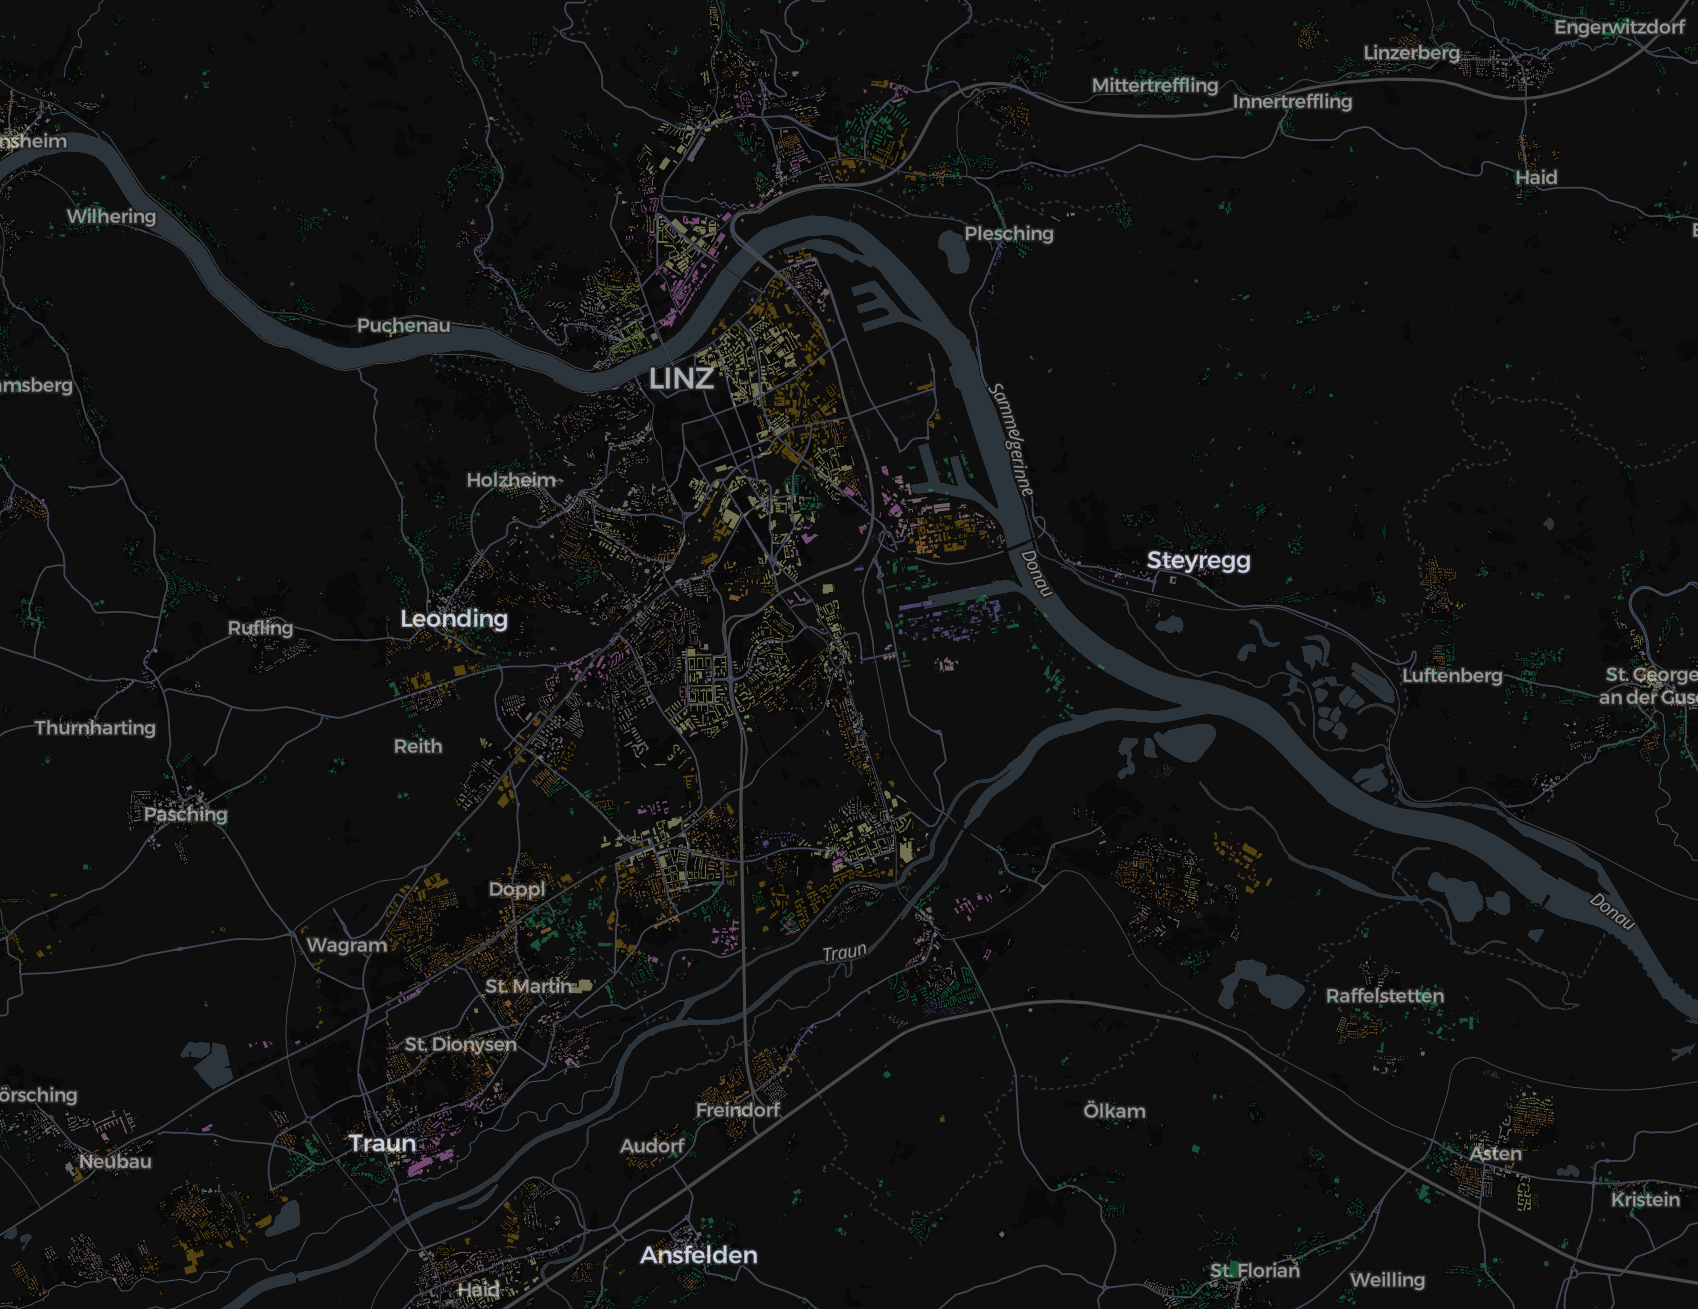
- Available as a web app (https://uscuni.org/himoc/).
- Naming of clusters and branches will be based on stakeholder feedback
Microsoft Building footprints
- There is a cache of previous data for Central Europe in the Planatery Computer Stack API
- We are exploring if it might improve model performance if we add it to the pipeline.
Current implementation status
- The core functionality for the pipeline was made available within open-source packages -
momepy,libpysal,neatnetand the project itself is a public repository. - We replaced the previous iteration of target labels with the new ones.
- Added the capability to calculate spatially lagged variables for the whole dataset.
Model development
First full model iterations
- Tested on different levels of aggregation
- The goal is to keep the final model as simple, scalable and interpretable as possible.
- Tested Random Forest, XGboost, histogramClassifier
- Reported accuracies are from the Random forest model, but the other models had similar performance.
First iteration results - Hierarchy Level 3
| Overall metrics | |
|---|---|
| Accuracy | 0.59929 |
| Weighted F1 score | 0.6222459 |
| Micro F1 score | 0.59929 |
| Macro F1 score | 0.4828 |
| Class F1 scores | |
|---|---|
| Linear Road Network Developments | 0.188530 |
| Large Scale Deelopments | 0.3588 |
| Central Urban Developments | 0.482 |
| Street-aligned Developments | 0.4836 |
| Sparse Rural Deelopment | .468680 |
| Sparse Rural Development | 0.513121 |
| Urban Developments | 0.642038 |
| Sparse Road Network Developments | 0.7192 |
First iteration results - Hierarchy Level 4
| Overall metrics | |
|---|---|
| Accuracy | 0.40672 |
| Weighted F1 score | 0.447 |
| Micro F1 score | 0.40672 |
| Macro F1 score | 0.2985 |
| Class F1 scores | |
|---|---|
| Large Interconnected Blocks | .260351 |
| Aligned Winding Streets | .277410 |
| Dense Connected Developments | .296238 |
| Large Utilitarian Development | .308157 |
| Cul-de-Sac Layout | .468680 |
| Sparse Rural Development | .512501 |
| Sparse Open Layout | .519002 |
| Dense Standalone Buildings | .542844 |
| Class F1 scores | |
|---|---|
| Compact Development | .086292 |
| Dispersed Linear Development | .108051 |
| Linear Development | .154702 |
| Extensive Wide-Spaced Developments | .167201 |
| Sparse Road-Linked Development | .179611 |
| True labels vs Predicted labels | |
|---|---|
 |
 |
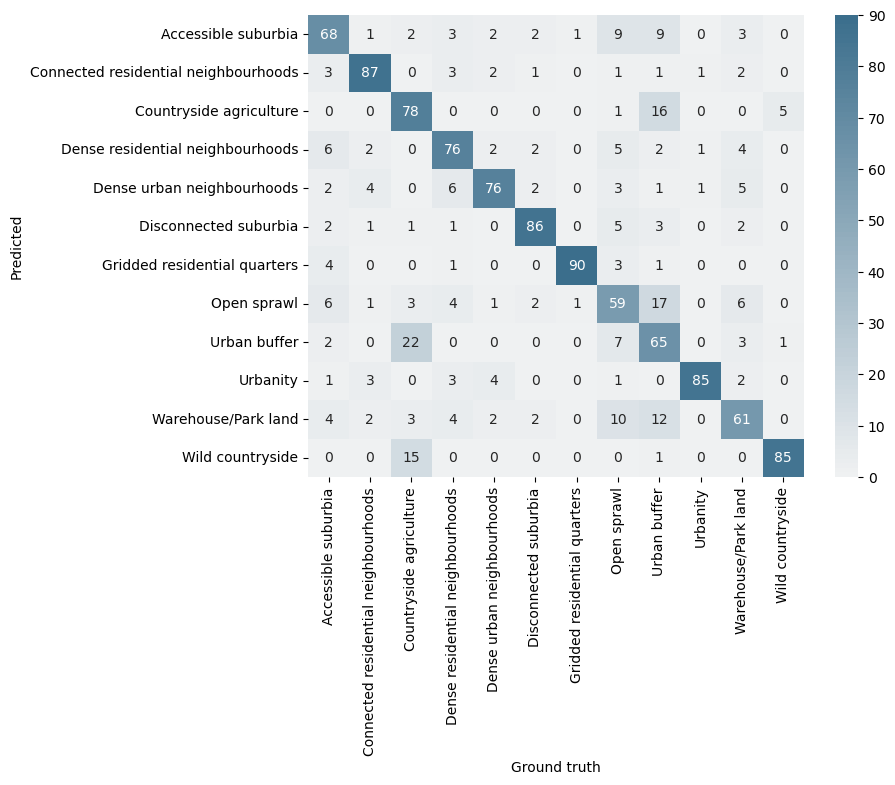
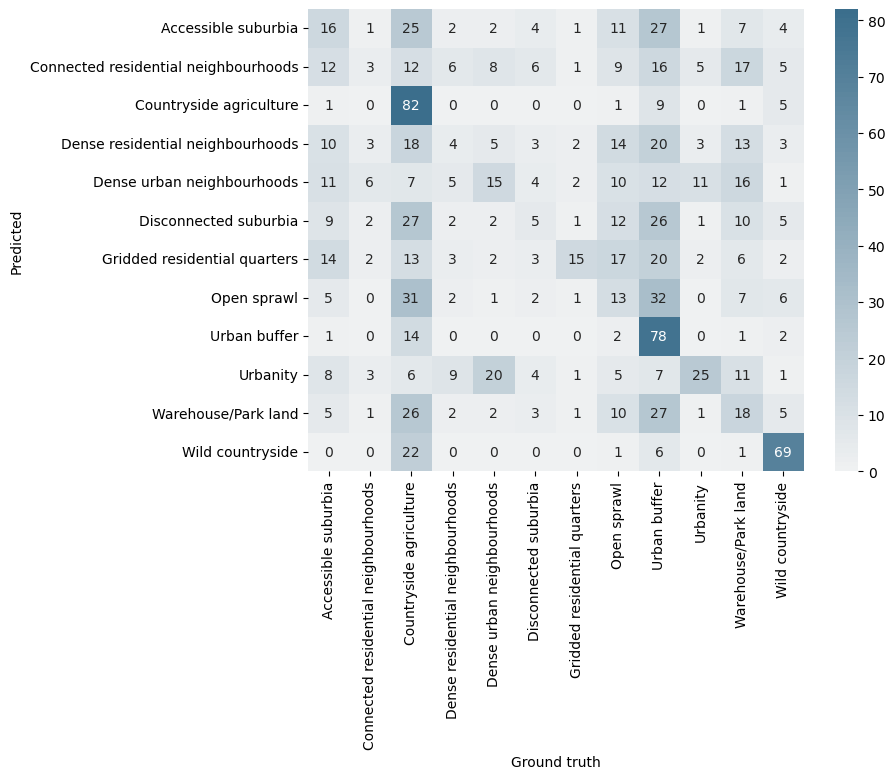
Missclassified labels
| True labels vs Predicted labels | |
|---|---|
 |
 |
Missclassified labels
Next steps
- Iterate and improve model accuracy for the poor performing classes.
- Write validation and comparison schemes to examine model results at different scales of the detailed cadastre classification.
Progress on imagery components
- AI model design: June-October 2024
- AI model development and training: September-November 2024
- European space-time urban strategy: December-March 2025
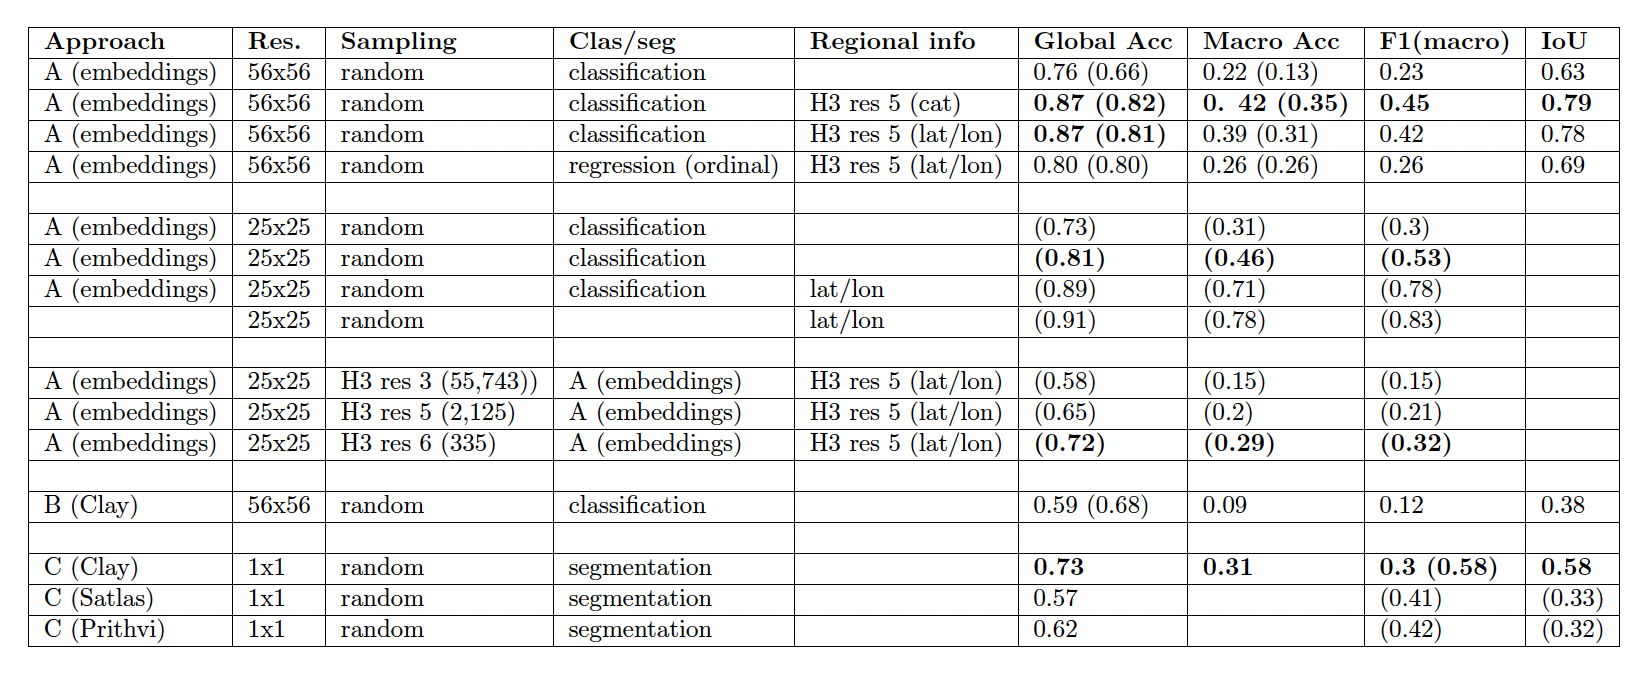
AI model design
- Scale: Pixel vs patch (size)
- Task: Classification vs segmentation
- Models: Network architectures and foundation models
- Sampling and geospatial information: Unbalanced dataset and spatial autocorrelation
Final model: quick recap
- Embeddings created from 25 x 25 pixel tiles
- Weighted XGBoost classifier
Prediction pipeline
- Input: shapefile + satellite composite
- creates tiles
- creates embeddings
- loads classifier and feeds in embeddings
- Output: spatial signature prediction
github.com/eurofab-project/eo/tree/main/ai_pipeline
Understanding model performance
| Accuracy | Macro Acc. | F1 (macro) |
|---|---|---|
| 0.66 | 0.48 | 0.36 |
Model performance
- full dataset / test set
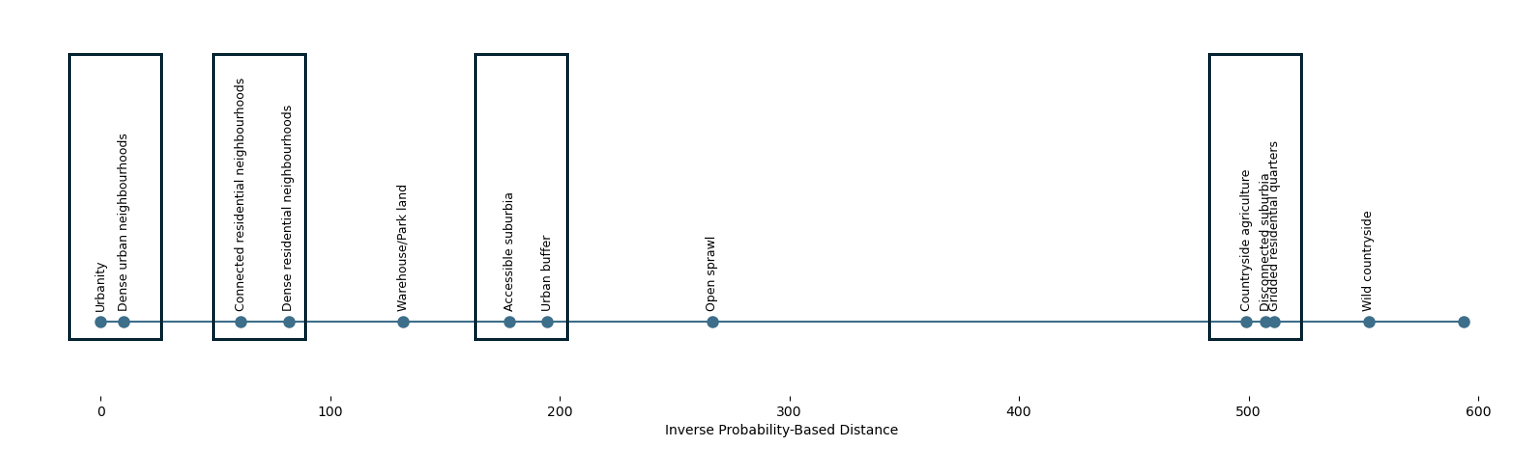
Inverse probability (ordered)
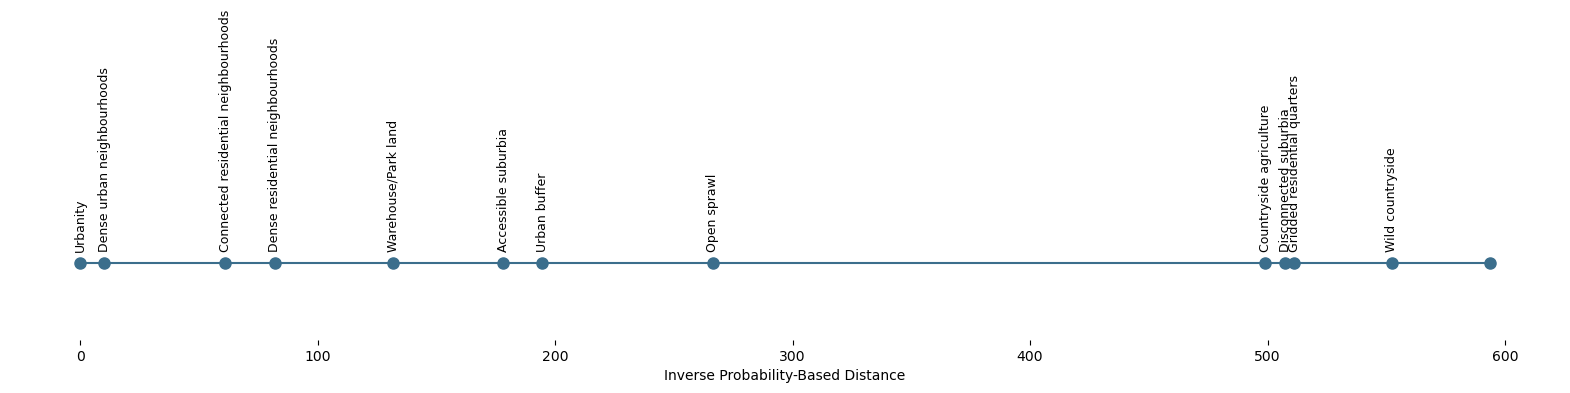
Inverse probability (ordered)
Predictions across time
- Satellite composites from 2016 → 2021
- Fed into prediction pipeline
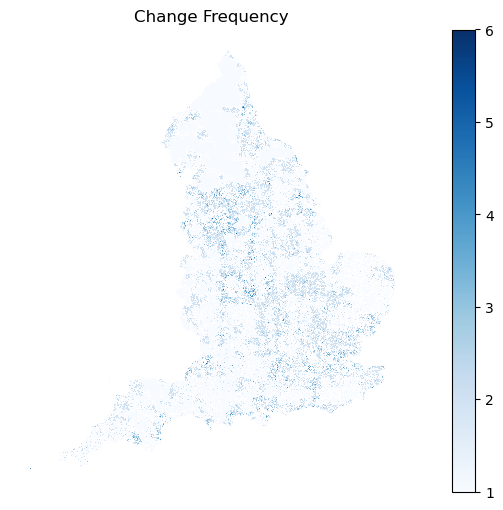
Number of changes from 2016 → 2021
Similarity across years
| Year transition | Overlap |
|---|---|
| 2016 → 2017 | 0.88 |
| 2017 → 2018 | 0.88 |
| 2018 → 2019 | 0.86 |
| 2019 → 2020 | 0.86 |
| 2020 → 2021 | 0.88 |
| 2016 → 2021 | 0.88 |
Understanding yearly change
![]()
![]()
![]()
![]()
Potential aggregations for data product
based on:
- model performance
- yearly transitions

Model performance across aggregations
| Acc. | Macro Acc. | F1 (macro) | Granularity | |
|---|---|---|---|---|
| Spatial + urbanity | 0.73 | 0.48 | 0.45 | 12 |
| Model performance 1d | 0.74 | 0.63 | 0.58 | 7 |
| Temp. high prob. | 0.74 | 0.62 | 0.58 | 7 |
| Temp. 1d | 0.74 | 0.68 | 0.64 | 6 |
| Visual grouping | 0.83 | 0.72 | 0.67 | 4 |
| (Non)urban | 0.97 | 0.83 | 0.78 | 2 |
Comparison to reclustered baseline
Spatial singature dataset with K=7
| Acc. | Macro Acc. | F1 (macro) | Granularity | |
|---|---|---|---|---|
| Model performance 1d | 0.74 | 0.63 | 0.65 | 7 |
Next steps/ areas of improvement
Model
- Sampling
- Spatial weights
Output maps
- Resolution/aggregations
- Uncertainties
Transferability to other countries
Progress on stakeholder components
Web application
- Developed an interactive web-application for the stakeholder engagement work
- We have a list of desirable features from all the presentations
Meetings with stakeholders
- Presented the new classification for SSVA Lithuania on the 27th of January (online)
- Presented for 4city on the 28th of January (in person)
- Presenting on the 11th of March for IPPA (in person)
Project continuation
Discussion
![]()