import geopandas as gpd
import numpy as np
import matplotlib.pyplot as plt
from shapely import boxHilbert distance-based split into train and test
This notebook illustrates the core of the approach to split chips into train and test used in the CEUS paper. There it was a bit more complicated than that but the principle is illustrated here.
Get only a subset of the country for illustration - NW.
start_x, start_y, end_x, end_y = (321566, 365379, 468106, 437198)Load the data and clip them to the box defined above. The data from https://figshare.com/ndownloader/files/38736501
signatures  = gpd.read_file(
    "/Users/martin/Downloads/spatial_signatures_GB_simplified.gpkg",
    bbox=(start_x, start_y, end_x, end_y)
).clip(box(start_x, start_y, end_x, end_y))
Get coordinates of chip centroids.
x_coords = np.arange(start_x, end_x, 250)
y_coords = np.arange(start_y, end_y, 250)
xv, yv = np.meshgrid(x_coords, y_coords)
combinations = np.vstack([xv.ravel(), yv.ravel()])
Get chip geoemtry.
grid_cells = gpd.GeoSeries.from_xy(x=combinations[0], y=combinations[1], crs=signatures.crs).buffer(125, cap_style=3)Filter only those fully within signatures.
sig_idx, grid_idx = grid_cells.sindex.query(signatures.geometry, predicate="contains")
valid_grid_cells = grid_cells.iloc[grid_idx].to_frame('geometry')
valid_grid_cells["sig_id"] = sig_idx
Get unique signature IDs to pull from.
unique = valid_grid_cells.sig_id.unique()
unique.shape[0]745valid_grid_cells.sig_id.value_counts().describe()count 745.000000
mean 153.918121
std 1712.829432
min 1.000000
25% 1.000000
50% 5.000000
75% 15.000000
max 37716.000000
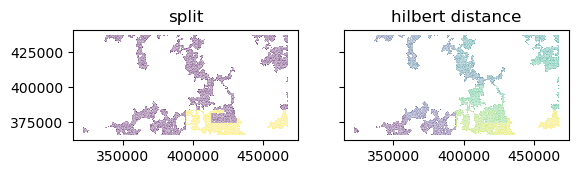
Name: count, dtype: float64Illustrate the split using Hilbert distance. Chip groups with less than 20 chips are not split and should be allocated together either to train or test. The distance itself could be retrieved via GeoSeries.hilbert_distance() if needed.
g = valid_grid_cells[valid_grid_cells.sig_id == unique[0]]
if g.shape[0] > 20:
    split = np.empty(g.shape[0], dtype=int)
    floor = int(np.floor(g.shape[0] * 0.8))
    split[:floor] = 0
    split[floor:] = 1
else:
    split = np.ones(g.shape[0])

f, ax = plt.subplots(1, 2, sharey=True)
g.sort_values("geometry").plot(split, ax=ax[0], edgecolor='w', linewidth=.1)
g.sort_values("geometry").plot(cmap="viridis", ax=ax[1], edgecolor='w', linewidth=.1)
ax[0].set_title("split")
ax[1].set_title("hilbert distance")
Text(0.5, 1.0, 'hilbert distance')