import numpy as np
import pandas as pd
from numba import njit

import urbangrammar_graphics as ugg
import seaborn as sns
import matplotlib.pyplot as plt

%matplotlib inlineSimulated Annealing
# Generate a random 12x12 confusion matrix with integer values
np.random.seed(42)  # For reproducibility
conf_matrix = np.random.randint(0, 100, size=(12, 12))

# Define class labels
class_dict = {
    'Accessible suburbia': 0,
    'Connected residential neighbourhoods': 1,
    'Countryside agriculture': 2,
    'Dense residential neighbourhoods': 3,
    'Dense urban neighbourhoods': 4,
    'Disconnected suburbia': 5,
    'Gridded residential quarters': 6,
    'Open sprawl': 7,
    'Urban buffer': 8,
    'Urbanity': 9,
    'Warehouse/Park land': 10,
    'Wild countryside': 11
}

# Reverse lookup for labels
class_labels = {v: k for k, v in class_dict.items()}

# Plot the heatmap
plt.figure(figsize=(10, 8))
sns.heatmap(conf_matrix, annot=True, fmt='d', cmap=sns.light_palette(ugg.HEX[1], n_colors=100), xticklabels=class_labels, yticklabels=class_labels)
plt.xlabel("Predicted Label")
plt.ylabel("True Label")
plt.title("12x12 Confusion Matrix")
plt.show()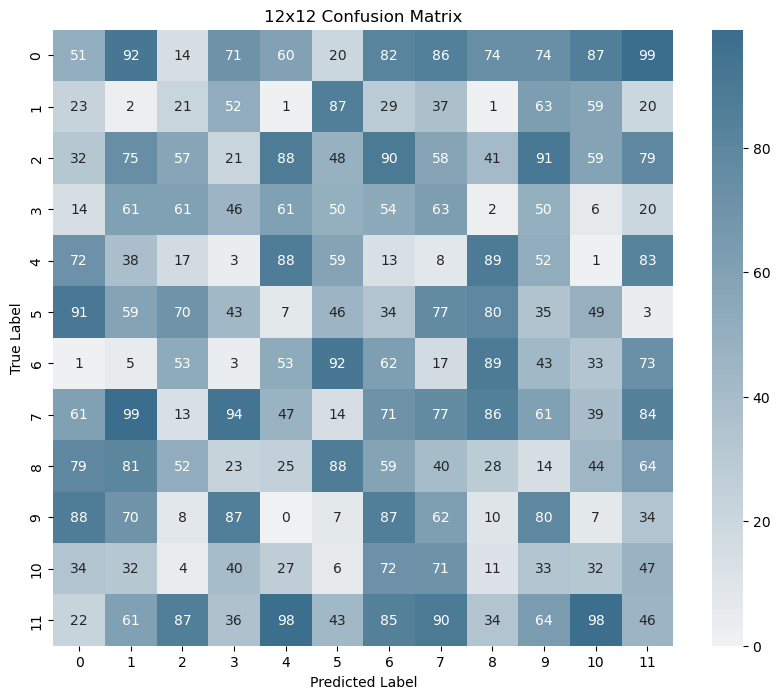
@njit
def nscore(a):
ds = []
r = range(len(a))
for i in r:
for j in r:
if a[i, j] != 0:
ds.append(abs(i-j))
return np.array(ds).mean()
@njit
def wnscore(a):
ds = []
r = range(len(a))
total = a.sum()
for i in r:
for j in r:
aij = a[i, j]
if aij != 0:
ds.append(abs(i-j) * aij / total)
return np.array(ds).mean()
#Bit hacky but fast(er) sorting algorithm that doesn't use all permutations (which takes more than 1h for a 12x12 grid).
def simulated_annealing(a, w=True, max_iters=500000, temp=1.0, cooling_rate=0.995):
"""
Optimizes the row/column order using simulated annealing.
Args:
a: The 2D numpy array.
w: Whether to use weighted nscore.
max_iters: Maximum number of iterations.
temp: Initial temperature for annealing.
cooling_rate: Decay rate for temperature.
Returns:
The best found permutation.
"""
if w:
scorer = wnscore
else:
scorer = nscore
la = len(a)
# Initial permutation (sorted by row sums as a heuristic)
current_perm = np.argsort(a.sum(axis=1))
best_perm = current_perm.copy()
best_score = scorer(a[current_perm, :][:, current_perm])
for _ in range(max_iters):
temp *= cooling_rate # Reduce temperature
# Swap two random indices
new_perm = current_perm.copy()
i, j = np.random.choice(la, 2, replace=False)
new_perm[i], new_perm[j] = new_perm[j], new_perm[i]
# Compute new score
new_score = scorer(a[new_perm, :][:, new_perm])
# Accept new permutation if it's better or with a probability
if new_score < best_score or np.exp((best_score - new_score) / temp) > np.random.rand():
current_perm = new_perm
best_score = new_score
best_perm = new_perm
# Stop early if temperature is too low
if temp < 1e-6:
break
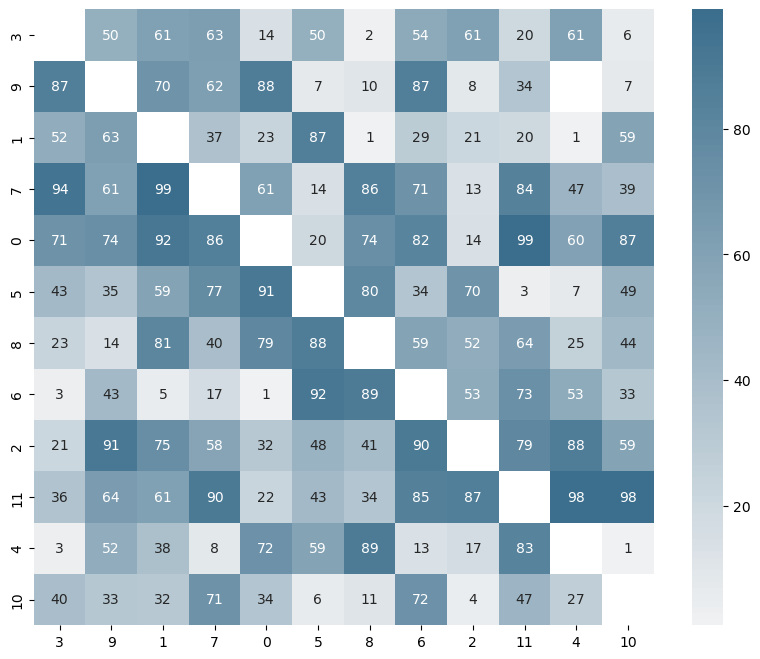
return best_perm#cols = list(class_labels.values()) # Get class labels as list
cols = list(range(0,12))
tab = pd.DataFrame(conf_matrix) # Copy the transition matrix
# ensure column names match correctly
#cols = [i.strip() for i in cols] # Remove any unwanted spaces
stab = tab.loc[cols, cols] # Reorder based on labels
# remove the diagonal
stab_no_diag = stab.copy()
np.fill_diagonal(stab_no_diag.values, 0) # Set diagonal to zero
# Sorting
order = simulated_annealing(stab_no_diag.values, w=False) # Unweighted score sorting
weighted_order = simulated_annealing(stab_no_diag.values, w=True) # Weighted score sorting
stab_sorted = stab.iloc[order, order] # Reorder rows and columnsplt.figure(figsize=(10, 8))
# Plot heatmap
sns.heatmap((stab_no_diag.iloc[weighted_order, weighted_order]).replace(0, np.nan).astype('float'),
cmap=sns.light_palette(ugg.HEX[1], n_colors=100),
annot=True)
# Show plot
plt.show()