import pandasSorting based on co-occurence
Get co-occurence table
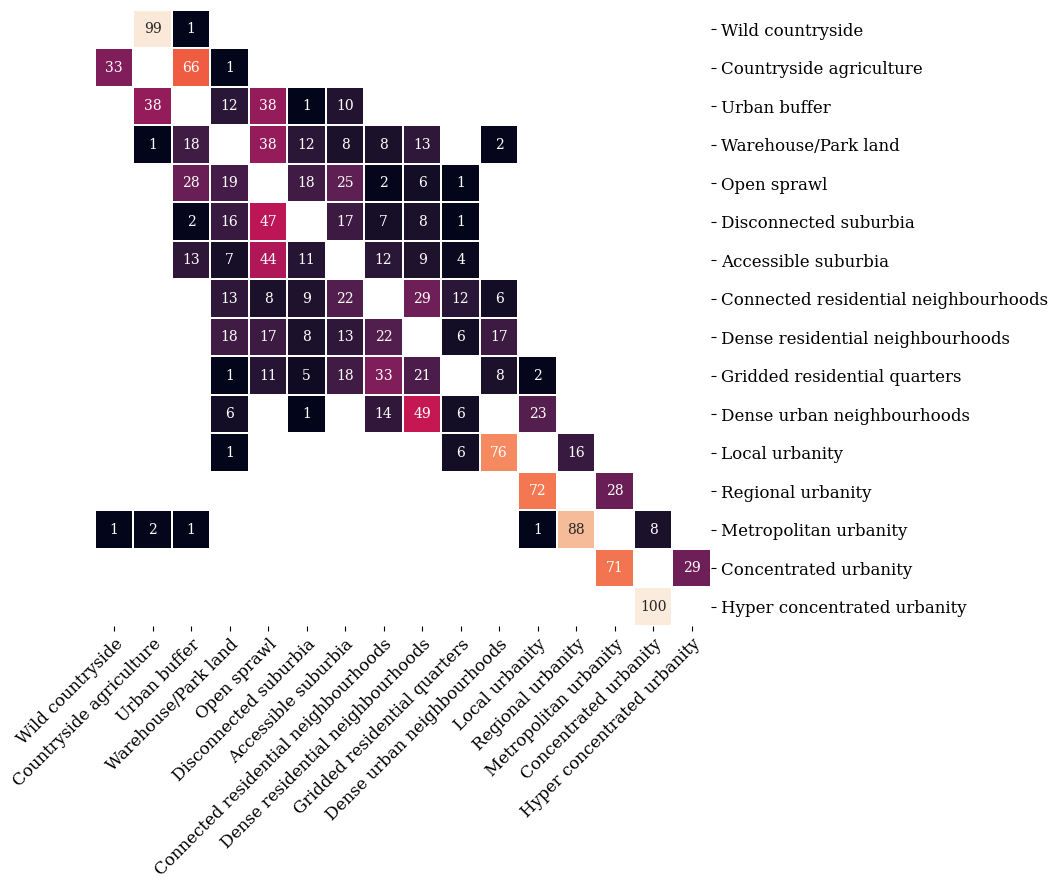
# https://urbangrammarai.xyz/spatial_signatures/esda/co-occurence.html
tab = """
neighbor_type   Countryside agriculture     Accessible suburbia     Dense residential neighbourhoods    Connected residential neighbourhoods    Dense urban neighbourhoods  Open sprawl     Wild countryside    Warehouse/Park land     Gridded residential quarters    Urban buffer    Disconnected suburbia   Local urbanity  Concentrated urbanity   Regional urbanity   Metropolitan urbanity   Hyper concentrated urbanity
Countryside agriculture     0   6   0   3   0   11  7323    181     1   14659   0   3   0   0   3   0
Accessible suburbia     6   0   2710    3573    2   13403   6   2068    1079    4070    3423    0   0   0   0   0
Dense residential neighbourhoods    0   2710    0   4622    3457    3450    0   3632    1246    25  1600    1   0   0   0   0
Connected residential neighbourhoods    3   3573    4622    0   1012    1222    1   2163    1939    35  1508    2   0   1   0   0
Dense urban neighbourhoods  0   2   3457    1012    0   5   0   414     443     1   52  1603    0   0   0   0
Open sprawl     11  13403   3450    1222    5   0   2   10383   660     14793   9521    0   0   0   0   0
Wild countryside    7323    6   0   1   0   2   0   0   2   48  0   4   0   0   1   0
Warehouse/Park land     181     2068    3632    2163    414     10383   0   0   73  4837    3313    30  0   0   0   0
Gridded residential quarters    1   1079    1246    1939    443     660     2   73  0   16  273     133     0   0   0   0
Urban buffer    14659   4070    25  35  1   14793   48  4837    16  0   420     3   0   0   1   0
Disconnected suburbia   0   3423    1600    1508    52  9521    0   3313    273     420     0   0   0   1   0   0
Local urbanity  3   0   1   2   1603    0   4   30  133     3   0   0   0   341     1   0
Concentrated urbanity   0   0   0   0   0   0   0   0   0   0   0   0   0   0   12  5
Regional urbanity   0   0   0   1   0   0   0   0   0   0   1   341     0   0   133     0
Metropolitan urbanity   3   0   0   0   0   0   1   0   0   1   0   1   12  133     0   0
Hyper concentrated urbanity     0   0   0   0   0   0   0   0   0   0   0   0   5   0   0   0
"""
from io import StringIO
tab = pandas.read_table(StringIO(tab), index_col='neighbor_type ')
tab = (
    tab
    .divide(tab.sum(axis=1), axis=0)
    .round(2)
    #.replace(0, numpy.nan)
    .astype('float')
    * 100
)
tab.index = [i.strip(' ') for i in tab.index]
tab.columns =[i.strip(' ') for i in tab.columns]tab| Countryside agriculture | Accessible suburbia | Dense residential neighbourhoods | Connected residential neighbourhoods | Dense urban neighbourhoods | Open sprawl | Wild countryside | Warehouse/Park land | Gridded residential quarters | Urban buffer | Disconnected suburbia | Local urbanity | Concentrated urbanity | Regional urbanity | Metropolitan urbanity | Hyper concentrated urbanity | |
|---|---|---|---|---|---|---|---|---|---|---|---|---|---|---|---|---|
| Countryside agriculture | 0.0 | 0.0 | 0.0 | 0.0 | 0.0 | 0.0 | 33.0 | 1.0 | 0.0 | 66.0 | 0.0 | 0.0 | 0.0 | 0.0 | 0.0 | 0.0 |
| Accessible suburbia | 0.0 | 0.0 | 9.0 | 12.0 | 0.0 | 44.0 | 0.0 | 7.0 | 4.0 | 13.0 | 11.0 | 0.0 | 0.0 | 0.0 | 0.0 | 0.0 |
| Dense residential neighbourhoods | 0.0 | 13.0 | 0.0 | 22.0 | 17.0 | 17.0 | 0.0 | 18.0 | 6.0 | 0.0 | 8.0 | 0.0 | 0.0 | 0.0 | 0.0 | 0.0 |
| Connected residential neighbourhoods | 0.0 | 22.0 | 29.0 | 0.0 | 6.0 | 8.0 | 0.0 | 13.0 | 12.0 | 0.0 | 9.0 | 0.0 | 0.0 | 0.0 | 0.0 | 0.0 |
| Dense urban neighbourhoods | 0.0 | 0.0 | 49.0 | 14.0 | 0.0 | 0.0 | 0.0 | 6.0 | 6.0 | 0.0 | 1.0 | 23.0 | 0.0 | 0.0 | 0.0 | 0.0 |
| Open sprawl | 0.0 | 25.0 | 6.0 | 2.0 | 0.0 | 0.0 | 0.0 | 19.0 | 1.0 | 28.0 | 18.0 | 0.0 | 0.0 | 0.0 | 0.0 | 0.0 |
| Wild countryside | 99.0 | 0.0 | 0.0 | 0.0 | 0.0 | 0.0 | 0.0 | 0.0 | 0.0 | 1.0 | 0.0 | 0.0 | 0.0 | 0.0 | 0.0 | 0.0 |
| Warehouse/Park land | 1.0 | 8.0 | 13.0 | 8.0 | 2.0 | 38.0 | 0.0 | 0.0 | 0.0 | 18.0 | 12.0 | 0.0 | 0.0 | 0.0 | 0.0 | 0.0 |
| Gridded residential quarters | 0.0 | 18.0 | 21.0 | 33.0 | 8.0 | 11.0 | 0.0 | 1.0 | 0.0 | 0.0 | 5.0 | 2.0 | 0.0 | 0.0 | 0.0 | 0.0 |
| Urban buffer | 38.0 | 10.0 | 0.0 | 0.0 | 0.0 | 38.0 | 0.0 | 12.0 | 0.0 | 0.0 | 1.0 | 0.0 | 0.0 | 0.0 | 0.0 | 0.0 |
| Disconnected suburbia | 0.0 | 17.0 | 8.0 | 7.0 | 0.0 | 47.0 | 0.0 | 16.0 | 1.0 | 2.0 | 0.0 | 0.0 | 0.0 | 0.0 | 0.0 | 0.0 |
| Local urbanity | 0.0 | 0.0 | 0.0 | 0.0 | 76.0 | 0.0 | 0.0 | 1.0 | 6.0 | 0.0 | 0.0 | 0.0 | 0.0 | 16.0 | 0.0 | 0.0 |
| Concentrated urbanity | 0.0 | 0.0 | 0.0 | 0.0 | 0.0 | 0.0 | 0.0 | 0.0 | 0.0 | 0.0 | 0.0 | 0.0 | 0.0 | 0.0 | 71.0 | 29.0 |
| Regional urbanity | 0.0 | 0.0 | 0.0 | 0.0 | 0.0 | 0.0 | 0.0 | 0.0 | 0.0 | 0.0 | 0.0 | 72.0 | 0.0 | 0.0 | 28.0 | 0.0 |
| Metropolitan urbanity | 2.0 | 0.0 | 0.0 | 0.0 | 0.0 | 0.0 | 1.0 | 0.0 | 0.0 | 1.0 | 0.0 | 1.0 | 8.0 | 88.0 | 0.0 | 0.0 |
| Hyper concentrated urbanity | 0.0 | 0.0 | 0.0 | 0.0 | 0.0 | 0.0 | 0.0 | 0.0 | 0.0 | 0.0 | 0.0 | 0.0 | 100.0 | 0.0 | 0.0 | 0.0 |
import numpy
a = numpy.array([
    [1, 0, 0, 4, 5],
    [2, 0, 0, 3, 5],
    [3, 0, 0, 2, 5],
    [4, 0, 0, 1, 5],
    [5, 5, 5, 5, 5]
])
ids = [f'i{i}' for i in range(len(a))]
a = pandas.DataFrame(a, index=ids, columns=ids)
b = numpy.array([
    [1, 0, 0, 0, 5],
    [2, 0, 0, 0, 5],
    [3, 0, 0, 0, 5],
    [4, 0, 0, 0, 5],
    [5, 5, 0, 0, 5]
])
from numba import njit
from itertools import permutations
@njit
def nscore(a):
ds = []
r = range(len(a))
for i in r:
for j in r:
if a[i, j] != 0:
ds.append(abs(i-j))
return numpy.array(ds).mean()
@njit
def wnscore(a):
ds = []
r = range(len(a))
total = a.sum()
for i in r:
for j in r:
aij = a[i, j]
if aij != 0:
ds.append(abs(i-j) * aij / total)
return numpy.array(ds).mean()
def sorter(a, w=True):
if w is True:
scorer = wnscore
else:
scorer = nscore
best = None
best_score = numpy.inf
la = len(a)
for seq in permutations(numpy.arange(la), la):
score = scorer(a[seq, :][:, seq])
if score < best_score:
best = seq
best_score = score
return bestcols = [
#'Countryside agriculture ',
'Accessible suburbia ',
'Dense residential neighbourhoods ',
'Connected residential neighbourhoods ',
'Dense urban neighbourhoods ',
'Open sprawl ',
#'Wild countryside ',
'Warehouse/Park land ',
'Gridded residential quarters ',
'Urban buffer ',
'Disconnected suburbia ',
#'Local urbanity ',
#'Concentrated urbanity ',
#'Regional urbanity ',
#'Metropolitan urbanity ',
#'Hyper concentrated urbanity'
]
cols = [i.strip(' ') for i in cols]
stab = tab.loc[cols, cols]
order = sorter(stab.values, w=False)
weighted_order = sorter(stab.values, w=True)order(3, 6, 1, 2, 5, 8, 0, 4, 7)weighted_order(7, 5, 4, 8, 0, 2, 1, 6, 3)rearr = (
['Wild countryside', 'Countryside agriculture'] +
stab.columns[list(weighted_order)].tolist() +
[
'Local urbanity',
'Regional urbanity',
'Metropolitan urbanity',
'Concentrated urbanity',
'Hyper concentrated urbanity'
]
)
rearr = [i.strip(' ') for i in rearr]import seaborn as sns
import matplotlib.pyplot as plt
plt.rcParams['font.family'] = 'serif'
fig, ax = plt.subplots(figsize=(8, 8))
sns.heatmap(
tab.loc[rearr, rearr].round(2).replace(0, numpy.nan),
annot=True,
fmt='.0f',
vmax=100,
square=True,
cbar=False,
linewidths=.2,
)
ax.tick_params('y',right=True, labelright=True, left=False, labelleft=False, rotation=0, labelsize=12)
ax.tick_params('x', rotation=45, labelsize=12)
ax.set_xticklabels(ax.get_xticklabels(), rotation=45, ha='right', rotation_mode='anchor')[Text(0.5, 0, 'Wild countryside'),
Text(1.5, 0, 'Countryside agriculture'),
Text(2.5, 0, 'Urban buffer'),
Text(3.5, 0, 'Warehouse/Park land'),
Text(4.5, 0, 'Open sprawl'),
Text(5.5, 0, 'Disconnected suburbia'),
Text(6.5, 0, 'Accessible suburbia'),
Text(7.5, 0, 'Connected residential neighbourhoods'),
Text(8.5, 0, 'Dense residential neighbourhoods'),
Text(9.5, 0, 'Gridded residential quarters'),
Text(10.5, 0, 'Dense urban neighbourhoods'),
Text(11.5, 0, 'Local urbanity'),
Text(12.5, 0, 'Regional urbanity'),
Text(13.5, 0, 'Metropolitan urbanity'),
Text(14.5, 0, 'Concentrated urbanity'),
Text(15.5, 0, 'Hyper concentrated urbanity')]