import sys
sys.path.insert(1, '/bask/homes/f/fedu7800/vjgo8416-demoland/spatial_signatures/eo/ai_pipeline')
import pandas as pd
import pipeline
from pipeline import GeoTileDataset, read_data, plot_examples
from torch.utils.data import Dataset, DataLoader
import matplotlib.pyplot as plt
import geopandas as gpd
%matplotlib inlineRun the pipeline
geojson_path = '/bask/homes/f/fedu7800/vjgo8416-demoland/spatial_signatures/eo/data/example/london_25_25_grid_clipped.geojson'
#geojson_path = '/bask/homes/f/fedu7800/vjgo8416-demoland/spatial_signatures/eo/data/example/liverpool_25_25_grid_clipped.geojson'
vrt_file = '/bask/homes/f/fedu7800/vjgo8416-demoland/satellite_demoland/data/mosaic_cube/vrt_allbands/2017_combined.vrt'#The function read_data(geojson_path, vrt_file) initialises a custom geospatial dataset and prepares a dataloader for batch processing.
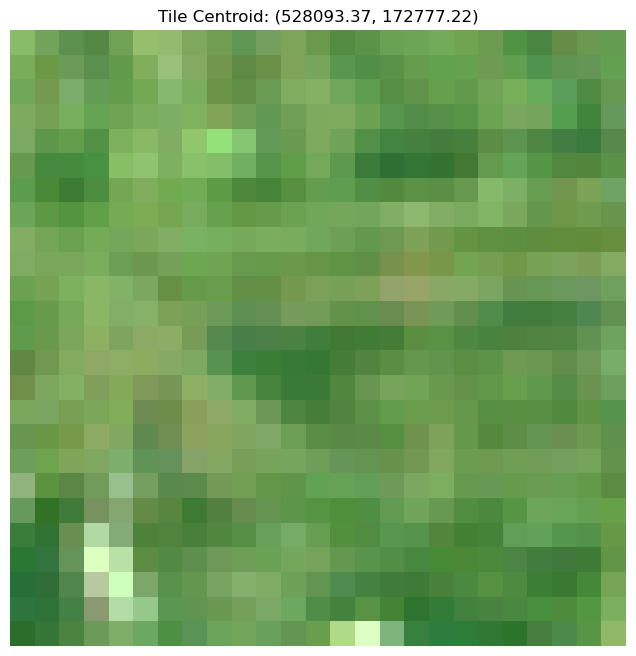
dataset, dataloader = read_data(geojson_path, vrt_file)#The function plot_examples(dataset, num_examples=n) is used to visualise example image tiles from the dataset.
#This helps in verifying the quality and preprocessing of the satellite imagery before using it in a model.
plot_examples(dataset, num_examples=3)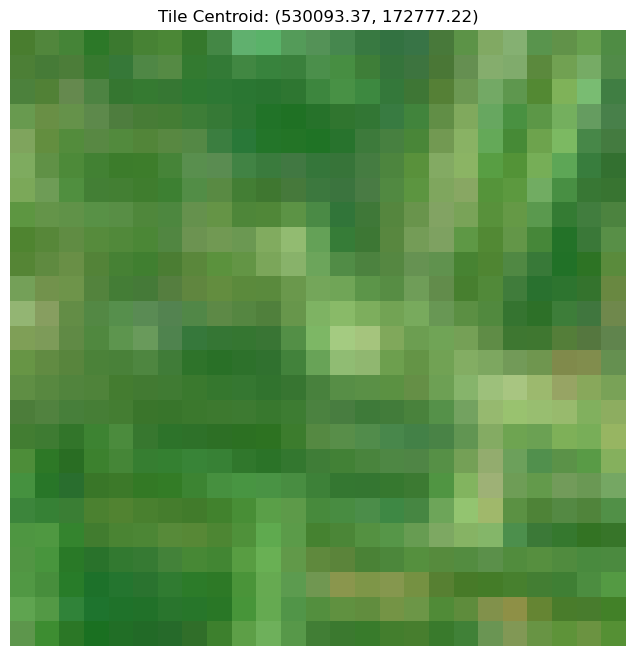

# Run the pipeline
pipeline.spatial_sig_prediction(
geo_path= "/bask/homes/f/fedu7800/vjgo8416-demoland/spatial_signatures/eo/data/example/london_25_25_grid_clipped.geojson",
vrt_file= "/bask/homes/f/fedu7800/vjgo8416-demoland/satellite_demoland/data/mosaic_cube/vrt_allbands/2017_combined.vrt",
xgb_weights = "/bask/homes/f/fedu7800/vjgo8416-demoland/spatial_signatures/eo/data/weights/xgb_model_25_latlonh6_feb25_weighted.bin",
model_weights = "/bask/homes/f/fedu7800/vjgo8416-demoland/satellite_demoland/models/satlas/weights/satlas-model-v1-lowres.pth",
output_path= "/bask/homes/f/fedu7800/vjgo8416-demoland/spatial_signatures/eo/data/predictions/test_london_h6.parquet",
h3_resolution=6
)# Run the pipeline
pipeline.spatial_sig_prediction(
geo_path= "/bask/homes/f/fedu7800/vjgo8416-demoland/spatial_signatures/eo/data/example/london_25_25_grid_clipped.geojson",
vrt_file= "/bask/homes/f/fedu7800/vjgo8416-demoland/satellite_demoland/data/mosaic_cube/vrt_allbands/2017_combined.vrt",
xgb_weights = "/bask/homes/f/fedu7800/vjgo8416-demoland/spatial_signatures/predictions/xgb_model_25_k7_latlonh0_feb25_weighted.bin",
model_weights = "/bask/homes/f/fedu7800/vjgo8416-demoland/satellite_demoland/models/satlas/weights/satlas-model-v1-lowres.pth",
output_path= "/bask/homes/f/fedu7800/vjgo8416-demoland/spatial_signatures/eo/data/predictions/test_london_h0.parquet",
h3_resolution=0
)# Run the pipeline
pipeline.spatial_sig_prediction(
geo_path= "/bask/homes/f/fedu7800/vjgo8416-demoland/spatial_signatures/eo/data/example/london_25_25_grid_clipped.geojson",
vrt_file= "/bask/homes/f/fedu7800/vjgo8416-demoland/satellite_demoland/data/mosaic_cube/vrt_allbands/2017_combined.vrt",
xgb_weights = "/bask/homes/f/fedu7800/vjgo8416-demoland/spatial_signatures/predictions/xgb_model_25_k7_latlonh5_feb25_weighted.bin",
model_weights = "/bask/homes/f/fedu7800/vjgo8416-demoland/satellite_demoland/models/satlas/weights/satlas-model-v1-lowres.pth",
output_path= "/bask/homes/f/fedu7800/vjgo8416-demoland/spatial_signatures/eo/data/predictions/test_london_h5.parquet",
h3_resolution=5
)test = gpd.read_parquet('/bask/homes/f/fedu7800/vjgo8416-demoland/spatial_signatures/eo/data/predictions/test_london_h5.parquet')class_labels_k7 = {'Countryside agriculture': 0, 'Open sprawl': 1, 'Other': 2, 'Urban': 3, 'Urban buffer': 4, 'Warehouse/Park land': 5, 'Wild countryside': 6}class_labels = {
'Accessible suburbia': 0,
'Connected residential neighbourhoods': 1,
'Countryside agriculture': 2,
'Dense residential neighbourhoods': 3,
'Dense urban neighbourhoods': 4,
'Disconnected suburbia': 5,
'Gridded residential quarters': 6,
'Open sprawl': 7,
'Urban buffer': 8,
'Urbanity': 9,
'Warehouse/Park land': 10,
'Wild countryside': 11
}test['class'] = test['prediction'].map({v: k for k, v in class_labels_k7.items()})test.explore(column='class', cmap='Accent')Make this Notebook Trusted to load map: File -> Trust Notebook
test.explore(column='class', cmap='Accent')Make this Notebook Trusted to load map: File -> Trust Notebook
# Run the pipeline
pipeline.spatial_sig_prediction(
#geo_path= "/bask/homes/f/fedu7800/vjgo8416-demoland/spatial_signatures/agri_grid_example.geojson", #/eo/data/example/liverpool_25_25_grid_clipped.geojson",
geo_path= "/bask/homes/f/fedu7800/vjgo8416-demoland/spatial_signatures/eo/data/example/liverpool_25_25_grid_clipped.geojson",
vrt_file= "/bask/homes/f/fedu7800/vjgo8416-demoland/satellite_demoland/data/mosaic_cube/vrt_allbands/2017_combined.vrt",
xgb_weights = "/bask/homes/f/fedu7800/vjgo8416-demoland/spatial_signatures/predictions/xgb_model_25_k7_latlonh5_feb25_weighted.bin",
model_weights = "/bask/homes/f/fedu7800/vjgo8416-demoland/satellite_demoland/models/satlas/weights/satlas-model-v1-lowres.pth",
output_path= "/bask/homes/f/fedu7800/vjgo8416-demoland/spatial_signatures/eo/data/predictions/test_liverpool_h5.parquet",
h3_resolution=5
)test2 = gpd.read_parquet('/bask/homes/f/fedu7800/vjgo8416-demoland/spatial_signatures/eo/data/predictions/test_liverpool_h5.parquet')# #test_liverpool_h0.parquet')test2['class'] = test2['prediction'].map({v: k for k, v in class_labels_k7.items()})test2.explore(column='class', cmap='tab20')Make this Notebook Trusted to load map: File -> Trust Notebook
test2.explore(column='class', cmap='tab20')Make this Notebook Trusted to load map: File -> Trust Notebook
test2.explore(column='class', cmap='tab20')Make this Notebook Trusted to load map: File -> Trust Notebook
test2.explore(column='class', cmap='tab20')Make this Notebook Trusted to load map: File -> Trust Notebook